
Disclaimers: - No communication should be considered as financial or trading advice. - All information in this lecture/course/seminar are intended and solely for educational purpose only. - They do not constitute investment advice in any manner whatsoever or have any regard to the specific investment objectives, financial situation or individual needs of any particular persons receiving them. - Examples are used for illustrative purposes only and do not constitute investment advice.
Monday, February 21, 2011
Saturday, February 19, 2011
When everybody is chasing higher price, who is selling then?

Years of trading have taught me not to chase stock which is heavily transacted with or without wide
price range. If the volume is extremely high says 2 - 5 times above the average volume. I would not
trade on that day, but I would choose to stay aside and watch the stock unfolds in the next few sessions.
If the stock continues to be bullish, i would expect price continues to go higher with substantial
volume but if price starts to fall below the pivot level, I would walk away and wait for the Blue
Diamond to trigger long trade.
Even though, we cannot forsee the possible run-up in the stock price in the near term.
A way to take advantage is to trade along with my propietarty indicator, "Go Long1" is able to
trigger long trade near the baseline where the price starts to move higher
from there. Usually the previous price bar is used as cutloss reference, and most of the time,
cutloss is seldom triggered even it could be just 2-5 cents away from the buy price.
The reason is simple, most of the indicators are coded taking future price into consideration
which means tomorrow conditions must be met so that the indicator will trigger today.
Most of the time when I trade, I never scan for home-run stock as we are not GOD to know.
Faithfully follow my Personal Diamond Trading System, I encounter many non eye-catching
stocks later turn into monster trades...So just work hard to make a good trade each time and
let the market decide where the stock price will be later and care less. The most important
thing I do after enter a trade is to watch the cutloss level like a hawk each day.
As long as the cutloss is not triggered, I am a winner to survive another day.
Cheers!
Friday, February 18, 2011
Why Majority of Traders tend to lose Money Chasing Explosive Price & Volume Day

Ok, I have some dollars to trade today and I am waiting for any stock that gives me bullish signal to
buy so that I can plug some money for coffee.
Oh, this stock has never been in the top 20 high volume list but today it has appeared with volume
exceeds 2 - 3 times normal daily volume.
Hmm, yesterday night, news reported that this company has bagged some new contracts worth xyz
million of dollars and today price starts to move up quickly with substantial volume after market open.
This stock looks so bullish, it must be my lucky day. I have been waiting for days and the time has
come for me to make some money.
Woo, the price has never traded with such a enormous gain of 25% price gain and extremely high
volume by late afternoon.
Ok, I have entered to queue to buy but it is still in the queue. Oh, market is going to close in an
hour's time and I need to run errand and may not have time to monitor the stock.
Ok, since the stock is moving higher with enormous volume, I think that it is ok to go along with
the tide. I am going to make some money this week, woo...I love this stock, hopefully it will run up
another 25% or more tomorrow and I can celebrate victory.
Ok, I cancel the previous queue and immediately buy at the ASK price.. Woo, I feel great after
transaction. I am going to make some money tomorrow for sure.. Ok, better inform my friend,
Alex, and let him know that this stock is a top performing today in Daily Top Volume and number
one spot.
Hmm, I am feeling like a champion. Can't wait to watch the market tomorrow again. What an
exciting day.
---------------------------------------------------
Above is the typical trader that trades stock on hunches and witness for yourself what happens
after the highly transaction day from the chart. I won't give you the answer, as the chart is clear.
Trading is never a simple game. It's the toughest game I ever play but I enjoy every single
moment.
Cheers
Sunday, February 13, 2011
Another Powerful Display of Blue Diamond Indicator detecting each turning point.
This is another demonstration on the Diamond Scanner which picks up stocks for further analysis every single day.
Inorder to trade well, I believe that we should not worry about not having stock to trade each day.
If a stock which we are holding is losing its upward momentum, it is best to protect the profits and
use the scanner to pick another potential stock to trade. No point holding on to a stock which is
exhibiting weakness and hoping that it will turn up in the future.
That is one of the reasons why I do not hang on to stock which shows weakness. Protecting profit or
know where to sell is as important as where to buy.
By taking profits on weakening stock and moving quickly to another stock picks up by the scanner proves
to be a nice way to compound earning again and again.
So in order to trade well, you need to have a Personal Trading System that includes the following:
1) A good Charting Software which allows personal coding of indicators and scanners
2) Stock Scanners that can pick up potential stocks for serious picking for income.
3) A strategy to cut loss and take profits base on what the market tell us.
4) Strong discipline to follow the system.
5) Nothing is free, when tips are from any sources, brokers or friends. Justify the claim from the chart
instead.6) Believe the chart, the professionals cannot lie to you as their footprints are caught in the transacted volume.
If you can decode the volume, you know how to master the market.
Inorder to track all activities of the professionals, I have created a trading system that alerts me as price moves forward each day. Most indicators today available in standard charting package are lagging in nature or are derivatives of price and volume.
Kelvin's Trading System is created purely by understanding the demand and supply of the market, using of
trend channel, trendlines to determine the probable trading range and seek to buy from the base of the channel and sell at the top of the channel. Many indicators require the Day + 1 (future day) to meet certain
criteria before an indicator alert will appear. This system seeks to decode the activity of the professionals
within a short time frame and ride the journey with the professionals.
Below is a nice chart on Streettrackers Gold, looking where the blue diamond (Go Long1) appeared
at the base of the channel each time, provides a very lucative trading position without fail.
With the help of the Diamond Scanner, I am able to study with great detail on the stock for trading
opportunity.


Friday, February 11, 2011
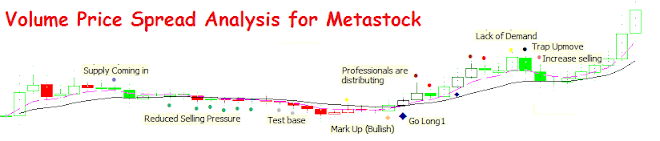
New Developed Indicator "Failed Test Bar" to determine Base Level Support Strength

This is a new indicator coded to detect failed base testing from the professionals.
Professionals are constantly probing market base so that they know they the particular stock
is ready to move up by flushing most of the sellers.
A successful test base would mean that the sellers may have given up and the selling power have
reduced significantly, this is usually detected by another expert indicator, "Reduced Selling Pressure".
So when test base is successful, usually we will expect price starts to move higher or sideway.
This indicator provides a quick overlook of what the professionals are doing and thereby providing me
with the ample time to react alongside with the professionals to take advantage of the market inefficient.
SGtrader
Email: failureisnotachoice@gmail.com
Youtube: SGtrader1
Sharejunction.com
Name: SGtrader
Facebook.com
Name: Smart Trader
Monday, January 24, 2011
Powerful Scanner picked up CapitalMallAsia For SHORT SELL on 24th Jan
Good Day Trader
My scanner picked up CapitalMallAsia for short sell candidate. Two expert indicators appeared concurrently
denoting bearishness in the stock.

Further analysis showed that there is potential for the price to go lower towards the targeted level as
marked on the chart. Here we are dealing with probability and no certainty, therefore whether
Long or Short order.
We must protect ourselves against unexpected outcome by setting cutloss level by all mean.
Below is the chart that I have analyzed with expert indicators and trendlines.

Wishing everyone a Profitable 2011 & Happy New Year!
Personal blogsites:
http://chartfreely-sg.blogspot.com/
http://chartfreely.wordpress.com/
http://volume-price-spread-for-metastock.blogspot.com/
http://chartfreely-sg.blogspot.com/
http://chartfreely.wordpress.com/
http://volume-price-spread-for-metastock.blogspot.com/
Tuesday, January 4, 2011
Learn and Excel Together, Great Questions by a Reader.
Thanks bro for your questions, hope I have answered your questions thoroughly.
-------------------------------------------------------------------------------------
SGtrader says:
The folloing replies represent my opinion and does not represent the masses
or constitue to any buy or sell advice from me. Solely for educational purpose.
Don't be too serious.
We are solely responsible for our trading activity in the market, when in doubt,
please consult your financial advisor for more assistance.
Cheers
----------------------------------------------------------------------------------------------
What is usually the signal for a buy?
1. When selling pressure decreased, low supply on sell side more on buy side.
Price near support or @ support range.
What is usually the signal for a buy?
1. When selling pressure decreased, low supply on sell side more on buy side.
Price near support or @ support range.
When selling pressure decreases, usually the sellers have already sold most of their inventories.
Price will continue to go lower due to momentum but soon price will start to move sideway to wait
for the next event to come. The sideway movement can last as long as the market decides.
Price will continue to go lower due to momentum but soon price will start to move sideway to wait
for the next event to come. The sideway movement can last as long as the market decides.
Until the next major events occur, it will continue to stay low. Base break out usually happens much
earlier then analysts coverage or news. This is becoz in most cases, many others related to the listed
company would have already knew the good news ahead and plan their purchases much earlier awaiting for
the news to break out to the public. This is usually detected by the unusual high transaction activities
when the stock is in sideway market but still within the trading range. This is sign of early accumulation
by the known persons. Take note: (This is my wild assumption and may not be true as Insider trading is illegal.
Read at your own risk.)
My system seeks to reveal this type of activity as it evolves…So that I can always position myself together
with them.Impt thing is to always watch your cutloss level no matter what happens…We are dealing with
probability in all cases.
with them.Impt thing is to always watch your cutloss level no matter what happens…We are dealing with
probability in all cases.
2. Good fundermentals
I don’t use fundamental analysis..I have seemed many lousy stocks become valuable after
massive speculation by pros..I also see cash rich company kana punished like nothing, there
is no logic at all. E.g Wilmar International
massive speculation by pros..I also see cash rich company kana punished like nothing, there
is no logic at all. E.g Wilmar International
Is wilmar fundamental weak after getting into property biz? No, still cash rich.
So why the stock is beaten down so much, due to fear and greed.
This sell down is seemed by me as a manipulated activities to cause many average traders to
unload their stocksto the pros who are actually accumulating but their activities are trying to
show that they are dumping.
unload their stocksto the pros who are actually accumulating but their activities are trying to
show that they are dumping.
Pros are known to play both sides of the market. They dump in the morning to create fear
and buy back cheaper at mkt close.
and buy back cheaper at mkt close.
If you follow my blog, you will see what I see..
http://www.sharejunction.com/sharejunction/listMessage.htm?topicId=9386&searchString=&msgbdName=Others&topicTitle=Are the Professionals ready to move
Wilmar UP?
Wilmar UP?
3. How do you really tell whether a stock is poised for a jump, by your expert
indicator.
If you know how to measure market expansion and contraction and compare to the stock that you are
analyzing, you will be able to see that the stock is now outperforming or underperforming the index.
I choose to pick stocks that outperform STI and it must be in stage 2 meaning I pick stock that is going
higher and higher and I love to buy higher price from the sellers. After all, this is the only way for price to
go higher if you understand bid and ask.
Please correct me if im wrong, i only know the tip of the iceberg.
Usually i look at the normal MACD, RSI, STO. I feel those are really not trustable
and its really only the surface and lagging.
I had used those common indicators for 3yrs and I also joined TASS society and took the market
technican exam. It’s take expert to know how to combine those Indicators and many will not reveal
much in their bootcamp. Using those indicators, you must be good at spotting divergence and
convergence.
technican exam. It’s take expert to know how to combine those Indicators and many will not reveal
much in their bootcamp. Using those indicators, you must be good at spotting divergence and
convergence.
Many times, you will be left indecisive when the indicators are floating in the air..e.g. when macd
is widely apart from the signal line. The call for sell is to wait for both MACD and signal lines to cross
over. But by then, most profits are gone or worse if it goes under your buy price.
is widely apart from the signal line. The call for sell is to wait for both MACD and signal lines to cross
over. But by then, most profits are gone or worse if it goes under your buy price.
I have tested my system again all past indicators that I use… The most important of all is that those
indicators cant ride a trend too long. Cross over now and then giving the signal to buy or sell. meaning
you are going to make your brokerage super-rich by trading excessively.
indicators cant ride a trend too long. Cross over now and then giving the signal to buy or sell. meaning
you are going to make your brokerage super-rich by trading excessively.
This system of mine help me to ride a trend up to a max of 3max which is long term to me. It will filter
short term noises and I am above to achieve very good % of returns. Just as example. If you use daily
chart to trade and how many times will the price be cutting the 13MA.
short term noises and I am above to achieve very good % of returns. Just as example. If you use daily
chart to trade and how many times will the price be cutting the 13MA.
What if I used 13MA in weekly chart to trade, how far can the price goes before triggering a sell signal?
My system looks into daily chart vulnerability and smoothen it with weekly chart.
My system looks into daily chart vulnerability and smoothen it with weekly chart.
I read "Way of the turtle" and i feel its a fantastic book where traders learnt to trade.
They used trend trading and also bought in around when close>20d ma.
I also compare with turtle style of trading. This system is much closer to what I am using now
but turtle triggers too much transaction in a uptrend.
but turtle triggers too much transaction in a uptrend.
For a retail trader, getting to trade in and out of the market too frequently is going to kill your capital.
My system will help me ride a trend until weakness is found.
My system will help me ride a trend until weakness is found.
See below chart on how I usually trade a stock. As below, I bought at channel low where two bullish
signals were picked by my combine scanner (reduced
signals were picked by my combine scanner (reduced
Selling pressure + uptrend) then I sold when the price started to come into the channel, I could had
sold on the 1st weakness indicator “Trap upmove”
sold on the 1st weakness indicator “Trap upmove”
But decided to give the stock some more room to move. At the end, it still fell and I exited with 39% returns in a short period.

If you compare my chart above with turtle indicator applied below, check the turtle indicators on the chart.
From my original chart, you can see the the price bars were green until the day I sold whereas for the turtle below, You could see some sell stop signal and red price bar.. This may cause worry to traders who could have exited due to profit protect too early before the trend becomes mature.

It would be appreciative if you would share some of your long learnt knowledge.
Thanks,
Cheers.
Thanks,
Cheers.
Subscribe to:
Posts (Atom)