Friday, April 29, 2011

Look to the LEFT when Trading, don't miss important turning point.


Ever wonder why history repeated itself over and over again. As seemed in the chart, what had happened in
June 2007, has repeated again in August 2010 with price headed up to 2007 high and reversed downward.
There is no coincidence at all.Both sold off happened after extremely high transaction volume weeks before where the Smart Money were busy transferring their holdings to their unwary HERD who thought there was further profits to be made. Just too bad, the market is always ready to punish those who are greedy and tried to take advantages of free ride. THERE IS NO FREE RIDE AND LUNCH IN THE MARKET.

It's not difficult to detect Smart Money activity and step out of the way, not getting trick into such
a common trap which happens every now and then.

Get educated & trained. You will be happy to enjoy trading for life!

What happen to the US Portfolio after I revised the stocks to replace?

On 23rd April, I did a portfolio update and remove two stocks and replace with a few stocks
that triggered the Blue Diamond "Go Long" expert indicator.

If you miss the earlier post, click on the link below:
http://volume-price-spread-for-metastock.blogspot.com/2011/04/using-same-trading-system-on-us-stocks.html

A week after the portfolio update, the portfolio has gone up usd22K as shown below:

There is no coincidence or luck factor, this is real stock analysis by understanding the activity of the
Smart Money and trade alongside to increase the opportunity of making good trades.


How to trade without Technical Indicators and Still Do Well?


There is no secret in my trading strategy. Without using complicated formulas to create lagging indicators,
I am better off using the only real time leading indicators, Price and Volume only.

By classifying a stock into CLASS A (stock without know resistance on the left), CLASS B (stock with
multiple resistances on the left), CLASS C (stock that is moving down with lower peaks)

By classifying a stock into 4 Stages, Stage 1 - Accummulation, Stage 2 - Advancing, Stage 3 - Distribution,
Stage 4 - Declining.

My favourite long trade setup: CLASS A + Stage 2.
My favourite short trade setup: CLASS C + Stage 4.

Long trade always happens in the BUY ZONE (1/4) and Potential Profit Taking is in SELL ZONE (4/4)
When go long, make sure that the channel is pointing up and the angle of ascending is at least 45% above,
the steeper the slope, the more aggressive is the Market to move the price higher. Likewise do the
opposite for Short trade.

There is no certainty in trading, we are dealing with probability, as such remember to plan CUT LOSS.


Saturday, April 23, 2011

Another Powerful Display of the Black Diamond, Look out for "No Demand" on the next 2 bars


Once Black Diamond appears, look out for the next two bars to see if there is no demand. If no demand
bar is detected (upbar with volume less than the last two transaction volume), it qualifies as Short Sell Candidate.

Past posting on similar topics as follow: Read if you have missed it earlier.

http://volume-price-spread-for-metastock.blogspot.com/2011/03/another-demonstration-of-newly.html
http://volume-price-spread-for-metastock.blogspot.com/2011/02/new-developed-indicator-that-inform-you.html
http://volume-price-spread-for-metastock.blogspot.com/2011/03/new-scanner-picks-up-stock-for-shorting.html

Using the Same Trading System on US Stocks - Portfolio update on 210411


Reshuffle the portfolio with some stocks such as "BBT" and "POM" will be taken out while
4 additional stocks that trigger "Go Long", Blue Diamond System have been added.
(This is a trial account from http://www.updown.com/ where I test and finetune the indicators and scanners
programming).

The Golden Rule of Trading

Wednesday, April 6, 2011

Another Example on How I use Stage Analysis to decide to buy or short sell?


By staging a stock into each cycle whether it is up, sideway or down. You can immediately know how to trade off this stock at the lowest risk.

But how? Simple, looking at the chart now, will you short a stock at Stage 2? Will you buy a stock at
Stage 4? So does that solve your problem by not getting you into the wrong stage of trading.

Let say that you bought a stock at Stage 2 and price is too far out from the moving average (black line),
don't worry, most mistakes made at Stage 2 will be forgiven. Why? price will pull back to the moving average to consolidate strength for the next higher upmove above the previous peak that you have entered.
As long as price continues to track along Stage 2 trend channel, don't worry pal.

If for me to trade any stock, it will be very near to the channel base with progressive volume coming
in to support the price trend. Buy when the stock is quietly moving up the channel. If it appears in the
Top Volume of the day, risk maybe getting high and I may not take a trade.


A sample of my classic Entry and Exit as shown in the chart below:

Notice: How the Propiertary Blue Diamond appeared along the base channel to trigger "Long
order" for me?

Tuesday, April 5, 2011

Why and When will I take Profits out from a Stock?


On 21st March, Blue Diamond,"Go Long" was triggered and I was supposed to take a trade the next day.
Due to the heavy workload in my current new Job as IT Presale Consultant, I just got it missed and took
a trade two days later on 23rd using my IPhone. Frankly speaking, I love to trade with Poems Mobile.
It is so handy and I can take a trade even when I am in the toilet, travelling to client's place. Once a trade is
transacted, I will immediately recieve an email to my inbox, what a great technology we have today?
If you are looking for a reliable remiser from Philip Securtiy, I can recommend my current broker who is responsive and man with integrity.(note, I have no referral fee at all. I have introduced at least 5 friends
who are new to trading to open an account with him). He will send his analysis often and I feel that it is
good for newbies.

Come back to the above chart, so I took a trade on 23rd March and I shared with friends around me through sms or whatsapp. The reply from most of them were "wa..so expensive stock and have gone up
alot already, don't think it will go up soon, better buy yang zi jiang, cosco or nol, cheaper leh".

Well, it really doesnt matter what the price of the stock is, what really matter is if the stock will move higher
from my entry level to make profits for me even it is expensive.

So I replied my friends " do you want to buy stock that is getting cheaper each day or getting more expensive each day to make a profit?" and the reply  was "the stock has to be expensive after purchase inorder to make a profit" . HAHA.... Then I said, "In this case, then why want to look for stock that is getting cheaper now or moving down the channel? and the usual reply would be "oh, because it is more affordable and I can buy more lots instead."

Frankly speaking, this is what I have heard over and over again from any friends who do not trade well or make some decent profits over a period of time. Many of them are in the state of confusion because most
of them want to buy stock that is getting cheaper each day and hoping for profit one day.

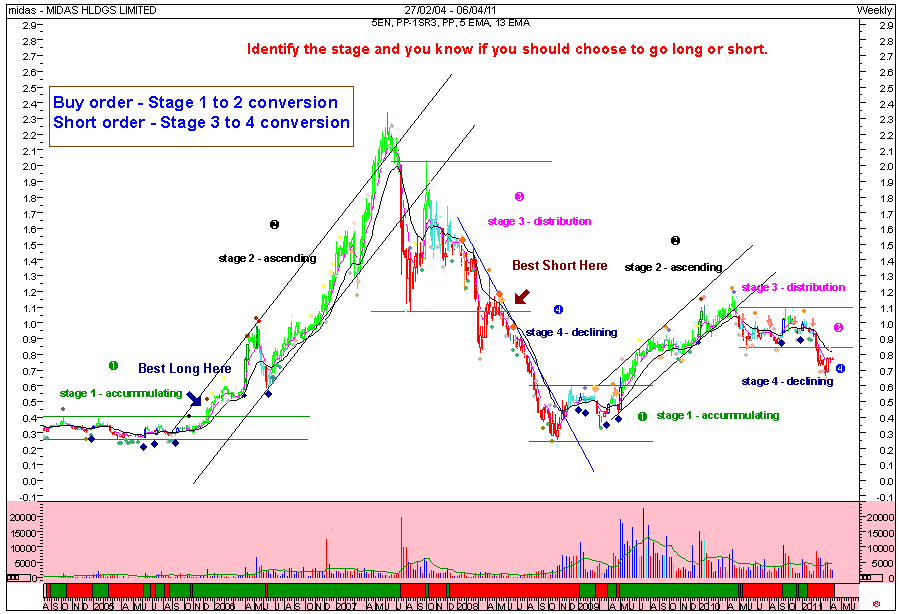
For me, I love stock getting more and more expensive each day especially in STAGE 2 and CLASS A stock.. So what is ClASS A, B, C and Stage 1,2,3,4 then... Below is an extract from my ebook written in 2003 title "Personal Trading System" to share what is CLASS A and Stage 2.

If you have joined the SGtrader's Trading Group, you will be taught this vital skills to survive in the market.

Class “A” stock

-        stock continues to trend higher after breakout. No known near term resistance.

-        risk is low and reward is high as price just starts to move out from base.
    
-        price is trending above 200MA (MA commonly used by fund managers)

-        breakout volume must be at least twice the average and the spread is equally wide.

STAGE 2: Advancing Phase

-        ideal stage to buy, stock swings out of its long term base, starts to trend higher.

-        profitable breakout usually occurs with large volume. 200MA turns up shortly after 
   breakout provides confirmation of strength

-        investors buy stock on the initial breakout or on the last pullback towards the
    breakout level. This is a 2nd chance to take advantage.


So Come back to the chart again, when combine with Classification of Stock and Stage Analysis with my
propiertary trading system, it becomes clear to me if I am riding the right stock with the right stage to make
an income. Base on the last two trading days, expert indicators "lack of demand" triggered twice. When
cluster of indicators appear consecutively, it has to be respected with full attention.

So how am I going to handle this situation when my trading system is sounding that there is weakness in
the current uptrend? I respect and follow the order by setting yesterday's low as the trigger point for me
to exit and take profit. If tomorrow onwards, price starts to fall below 04/04 low $5.92, I will walk away happily with what I have made within 10 trading days. Don't grin over too little profit made, just take what the market give me. Nothing is for sure in the market, we are dealing with probability. Stay healthy and be happy.

Cheers

Sunday, April 3, 2011

Combining Stage Analysis, SGtrader's Channel Trading & Expert Indicators - High Probability of Success.


     Stock Market goes through four stages of cycle, stage 1 - 4 with each stage plays an important part to
     the type of trading strategy to use and take advantage of the stage. This teaching is made popular by 
     the   author of " Secrets for Profiting from Bull and Bear" by Stan Weinsteins.
    
     When I first came across this book, it was doubtful with the title which began with "Secrets". Many
     authors like to use this strong word to attact readers to pickup their books and hopefully buy them. 
    Nevertheless, I picked up the book, scanned the front and back cover for more information and then
    the contents. As I read the book, I immediately knew that this could be the book that could assist me to
    break down the stock movement into stages and if I could use the right strategy for each stage, I should
    be ok.
    So I bought the book and treated it like a bible, I read and read each time when I had time until I
    understood the author's intention.

    I started to employ stage analysis to the charts in 2003 and was able to detect each stage as the
    Market unfolded. This is really an amazing skills to have. By staging the stock correctly, I am able to
    identify the accummulation, advancing, distribution and declining stages without any difficulty. The
    best of all, stage analysis prevents me to Sell Short a stock in Stage 2 Advancing Phase or Go Long
    in Stage 4 Declining Phase. This knowledge has kept me out of trouble by knowing which stage to
     apply the correct  trading strategy.

    Beside apply my own propiertary indicators and trend channel to a stock chart, I make use of stage    
    analysis as a qualifying criteria to pick up which stock to trade out of the hundreds. If I am planning for
    a "long trade", only stage 2 will be considered, if I am planning for "short sell", only stage 4 will be
    considered.

    With this method, I have less chance to make mistake trading in the wrong direction and improve my
    odd of success.

     Below is a sample chart on how I stage a stock for trade consideration.


Saturday, April 2, 2011

How the RTD Function in MSexcel work in Real Time Portfolio Management?


Good Day Traders

For those who have just joined the SGtrader's Trading Group,  you should have recieved an email to where you can download a sample of my Real-Time Portfolio using MSexcel RTD function. It is simple to use and manage.

Think Simple. Dont complicate a simple task into complicated issue. Just like many traders who
like to have more than 4 TA indicators in their stock chart. Many a time, each indicator will contridicate
each other and it does more harm then help. I do not use any of them now after I start to learn to read bar by bar which is the only leading indcator you can think of. Others are just derivatives of price and volume.

Cheers