Disclaimers: - No communication should be considered as financial or trading advice. - All information in this lecture/course/seminar are intended and solely for educational purpose only. - They do not constitute investment advice in any manner whatsoever or have any regard to the specific investment objectives, financial situation or individual needs of any particular persons receiving them. - Examples are used for illustrative purposes only and do not constitute investment advice.
Friday, April 29, 2011
Look to the LEFT when Trading, don't miss important turning point.
Ever wonder why history repeated itself over and over again. As seemed in the chart, what had happened in
June 2007, has repeated again in August 2010 with price headed up to 2007 high and reversed downward.
There is no coincidence at all.Both sold off happened after extremely high transaction volume weeks before where the Smart Money were busy transferring their holdings to their unwary HERD who thought there was further profits to be made. Just too bad, the market is always ready to punish those who are greedy and tried to take advantages of free ride. THERE IS NO FREE RIDE AND LUNCH IN THE MARKET.
It's not difficult to detect Smart Money activity and step out of the way, not getting trick into such
a common trap which happens every now and then.
Get educated & trained. You will be happy to enjoy trading for life!
What happen to the US Portfolio after I revised the stocks to replace?
On 23rd April, I did a portfolio update and remove two stocks and replace with a few stocks
that triggered the Blue Diamond "Go Long" expert indicator.
If you miss the earlier post, click on the link below:
http://volume-price-spread-for-metastock.blogspot.com/2011/04/using-same-trading-system-on-us-stocks.html
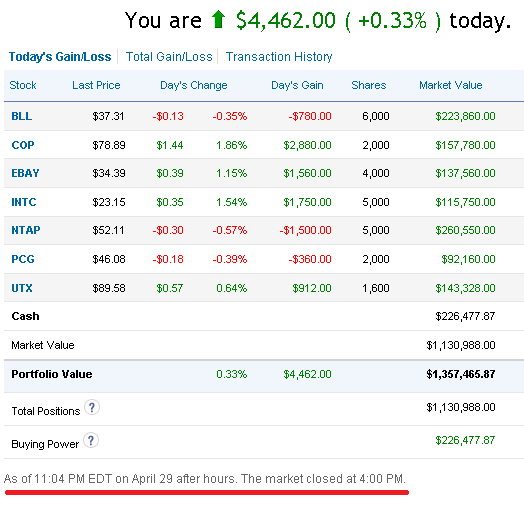
A week after the portfolio update, the portfolio has gone up usd22K as shown below:
There is no coincidence or luck factor, this is real stock analysis by understanding the activity of the
Smart Money and trade alongside to increase the opportunity of making good trades.
How to trade without Technical Indicators and Still Do Well?
There is no secret in my trading strategy. Without using complicated formulas to create lagging indicators,
I am better off using the only real time leading indicators, Price and Volume only.
By classifying a stock into CLASS A (stock without know resistance on the left), CLASS B (stock with
multiple resistances on the left), CLASS C (stock that is moving down with lower peaks)
By classifying a stock into 4 Stages, Stage 1 - Accummulation, Stage 2 - Advancing, Stage 3 - Distribution,
Stage 4 - Declining.
My favourite long trade setup: CLASS A + Stage 2.
My favourite short trade setup: CLASS C + Stage 4.
Long trade always happens in the BUY ZONE (1/4) and Potential Profit Taking is in SELL ZONE (4/4)
When go long, make sure that the channel is pointing up and the angle of ascending is at least 45% above,
the steeper the slope, the more aggressive is the Market to move the price higher. Likewise do the
opposite for Short trade.
There is no certainty in trading, we are dealing with probability, as such remember to plan CUT LOSS.
Saturday, April 23, 2011
Another Powerful Display of the Black Diamond, Look out for "No Demand" on the next 2 bars
Once Black Diamond appears, look out for the next two bars to see if there is no demand. If no demand
bar is detected (upbar with volume less than the last two transaction volume), it qualifies as Short Sell Candidate.
Past posting on similar topics as follow: Read if you have missed it earlier.
http://volume-price-spread-for-metastock.blogspot.com/2011/03/another-demonstration-of-newly.html
http://volume-price-spread-for-metastock.blogspot.com/2011/02/new-developed-indicator-that-inform-you.html
http://volume-price-spread-for-metastock.blogspot.com/2011/03/new-scanner-picks-up-stock-for-shorting.html
Using the Same Trading System on US Stocks - Portfolio update on 210411
Reshuffle the portfolio with some stocks such as "BBT" and "POM" will be taken out while
4 additional stocks that trigger "Go Long", Blue Diamond System have been added.
(This is a trial account from http://www.updown.com/ where I test and finetune the indicators and scanners
programming).
Thursday, April 21, 2011
210411 - Took a trade on this stock after posted it at http://chartfreely-sg.blogspot.com
Reference chart posted on 20/04, http://chartfreely-sg.blogspot.com/2011/04/china-xlx-fertiliser-weekly-chart.html
Subscribe to:
Posts (Atom)


