Friday, March 25, 2011

How to determine Risk & Reward for every trade?


Above is a usual trade setup uses by me to perform Risk to Reward analysis before I press the button to
buy or sell.

With a customized riskcalculator that I have programmed many years back, assisted me to determine
if the risk is worth to take or just let it go instead.

What make a good trader is nothing more than the tools he uses to trade the market. With simple
tool like this calculator, once can easily walk away from lousy deal,instead look for another stock
that presents better returns although there is no guarantee to win in trading. But we close the gap
up to make a good trade.

As you can see in this calculator, I have the cutloss level just beside the target level (near term resistance)
where I make this the 1st priority in any trading. Always determine where will be the cutloss, so that
you can easily obtain the risk and reward ratio at the end of the calculator. With this estimation of
the risk that you have to take inorder to recieve the rewards, you can easily make a quick decsion whether
to take the trade or just leave it along.

Many times, when we found a stock that is trading with excessive volume and has been trading higher for
past few days, we may have the urge to jump into the stock without analyzing chart on the possibly near
term resistance or support. With this risk calculator, you can easily enter the buy price (support level) and
sell price (near term resistance level) and cutloss (below recent support level). Once you have all these
data key in, you can check the risk to reward ratio if it is still a good trade.

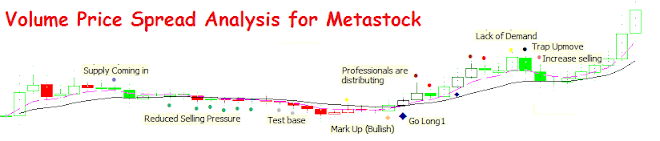
Never rush to buy a stock that has been in the top volume for days. Nothing is free as this could be a trap
setup by the professionals to trick the herd to go long so that the professionals can transfer their holdings
to the weaker buyers. Once the transferring is done, the stock will continue to move higher for the next few days but without volume to support this upmove, so the stock start to tumble down like a stack of cards.
Dont be greedy, just be patience in trading. Always buy at channel base where the stock is quiet and unnotice by majority where there is sign of accummulation from the professionals. Such indicators in my system to determine this strength is as follow:

Test Base - professionals are probing the base, if the next bar shows successful test, the price will go higher
Reduced Selling Pressure - after a big sell off, market starts to cool off slowly and move sideway, reduced selling pressure is witnessed as any selling has been absorbed by the professionals so that they can stage an upmove in the near future when the catalyst for a bullrun is present.
No Supply - selling has reduced significant and if there is no selling, stock will move sideway or uptrend.
Markup - price is marked up to trick shortists to cover their shorts, usually a "V" up move.
Demand coming in - professionals are coming in to buy  up with average to high transaction volume.
Bottom reversal - price reversal from bottom, forcing shortists to worry and cover shorts
Climatic action - heavy transaction volume at the lowest low but close higher near the day high, the professionals are finding worth in the stock and decide to absorb all selling and push price higher instead.

These are just some of the indicators that I have created by examing the demand and supply of the
market.

A good reference site to learn more about the price and volume action is the popular "tradeguider" video
from youtube. Where the professionals are telling the truth about the market.

Sunday, March 20, 2011

How to Swing Trade Effectively?


Many of the traders are unable to trade well or make unnecessary mistakes during hunches. If I tell
you that I do not watch the stock price every second, you may not believe it. 

Staring at the real time price(bid & ask) each second can cause severe heart attack and lousy trades.

Imagine that you come across a stock in the top 20 volume and price is moving up. You decide to open
the real time time and sale to see each transaction done. Every uptick in price makes you excite and lure
in to the trade which you have not done any analysis before hand. So you bought it in the morning session and watched the screen until market close. You felt like a champion that you had picked a steal from the market and money should be attracted to you soon.

Wait, second half of the session opened and Futures markets were down. Suddenly the local bourne
started to take a turn and STI index went from +30 pts to -50, now you were caught as the stock that
 you bought earlier started to pull back to it's open price and now you lost 5cts a share. How could this happen?

How could the market being superb positive in the morning, now turning negative in the last trading session?
so what should I do now? should I sell away the stock or wait for another day and hopefully the price would go back the bought price so that I could even out and exit.

What a emotion roller coaster? from winning to losing within a day? Must be bad luck.

Above is a typical scenerio experiences by many including me as well.

Is there a better way to trade and not to worry about daily volatility and able to sleep well each night?

Yes for me, from the above diagram. "Buy zone" is the area where I will go long base on price and volume
action to confirm a trade. Once in the long trade, as long as price is not below the "sell zone", I would
keep the stock and let the stock to wiggle its way up the channel.

So when I will start to seriously look at the stock? when it is in the upper channel, "sell zone", where I may decide to take profit due to confirmed weakness base of price and volume analysis.Or price has traded
below the "buy zone" and I would cut loss and wait for the next opportunity to re-enter or go for other stock
that is exhibiting strength to move higher in the "buy zone".

To summarize, when a stock is in either  "Buy zone" or "Sell zone", will I be interested to check the chart to identify potential strength or weakness.

When stock is in the "Do Nothing Zone", basically I will let the price to meander along the channel and do not bother by its activity each day until the price comes to the extreme ends (buy or sell zone)

Tuesday, March 15, 2011

New Scanner Picks up Stock for Shorting!


A new scanner that is coded to scan for weakness two days earlier and get you to watch out for the next two days price action. When "lack of demand" or other expert indicators such as go short, supply coming in or
top reversal, this may be a golden opportunity to go short sell with high probability setup.

Below is the stock that is picked up by the scanner on 15/3/11 closing price.


Above is the weekly chart, looking where the new expert indicator appeared "Look for No Demand for Shorting", we need to wait for the next two weeks trading session to reveal possible weakness.
Indeed, after the expert indicator triggered a week earlier, subsequent week triggered "Lack of demand",
This week as long as price is closing below the 50% level of the previous bar "Lack of demand",
short sell is recommended.

Monday, March 14, 2011

Another Stock Picks up by Scanner for Short Sell

Potential Stock for Shorting - Pick Up by Short Sell Scanner


    Scanner picked up City Developments for shorting on 14/03/11.


   If support at $10.80 is unable to hold price, expect further downside to retest the previous
   base @$10.50

Friday, March 11, 2011

Combining Stage Analysis and Diamond Trading System Can Keep Out of Trouble


Combining Stage Analysis on any chart with Propietary Diamond Trading System provide a
clear and clean understanding on how the Professionals activities are revealed to the masses
and how we can follow the footprints of the Smart Money and possibly trade alongside with
them. No matter how bullish or bearish, always guard your cutloss level.

Knowing the FOUR stages of stock cycle, can keep you out of trouble.


By identifying which stage is the stock now will keep you out of trouble. Such as never go long in stage 4.
Buying only happens on stage 2.

By charting the stock into four cycles, I can easily identify the cycle for long trade or short sell.

Cheers