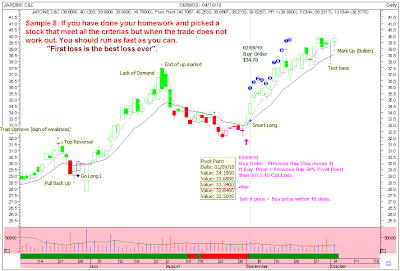
There are many risk management books that tell you how to cut loss and take profit when necessary.
The most important of all, the strategy must suit your own Personal Trading System.
Most of the trading books are catered for very short term trading such as Futures and Forex as
such applying the same methodology to slower Stock Market maybe backfired as the cutloss is
either too close or too far away.
The key issue here is when the cutloss level is triggered, will you be brave to cut away the losses
and endure temporary pain instead of ending up with losing position that deteriorate over the time and
most intense pain. I always believe "First lost, the best lost".
The strategy that outline here is solely for my style and may not be suitable for you, if you like too, you
may try this strategy too.
So what is my intention on this risk Management?
After analyzing multiple timeframes, monthly, weekly & daily chart of a stock which is picked up by my
proprietary diamond scanner. I will have an good idea where will be the next resistance level.
Therefore if this trade is taken, I am expecting the price to trade higher from the buy price and if that
does not happen, I have this strategy to follow:
Sell if closed price < 50% Previous Trading Day Pivot Point(Transacted Day - 1) or
If Price < Buy Price within the next 10 days.
Ok, why "Sell if closed Price < 50% Previous Trading Day Pivot Point"
The reason is simple, this method is used only during Initial Buy Order so that
price will not close below Previous Day Pivot Point. If it does, then expect price to fall further
until a base is formed or supported. If price does not trigger this cutloss, price should be
moving away from the cutloss level. This provide the 1st assurance that I can break even soon.
Next, If "Price < Buy Price within the next 10 days = Cut Loss"
If price does not trigger the previous day Pivot Point, price should be heading north. Giving
a short time frame of 2 weeks to see there is internal weakness and price cannot sustain the
upside and start to fall and trigger the cut loss.
If both of the risk management are not triggered after the 10th day, I will utilize the weekly chart
as the base for holding on the winning stock while using the daily chart to spot potential weakness
in the trend.
Most of the time, while the weekly chart is looking positive and price is pulling back to support
level in daily chart. There is no cause of alarm.
The time to stay alert and take profit will be when the weekly chart and daily chart are showing
trend weaknesses or expert indicators that appear in the upper channel level such as "Trap Upmove", " Higher Price is stopped", "Top Reversal", "End of Up Market", "Lack of Demand", "Bearish" or
"Increased Selling Activity".
What goes up like a rocket, will do the same as it comes down. So do not buy "HOPE" in the trading
arena, it will be too painful and expensive to bear.
When the both the Cut Loss Strategy have not been triggered, I will revert to weekly chart as shown
below to allow more room for price to move further up. While using daily chart to detect early
sign of weakness.
As I said before, this is My Way. You may have a better way to do it.
Important, we just want to take some profit from the Market each time, no matter what
kind of methods we adore.
Best Wishes and Making Profitable Trading Ahead.


