
Disclaimers: - No communication should be considered as financial or trading advice. - All information in this lecture/course/seminar are intended and solely for educational purpose only. - They do not constitute investment advice in any manner whatsoever or have any regard to the specific investment objectives, financial situation or individual needs of any particular persons receiving them. - Examples are used for illustrative purposes only and do not constitute investment advice.
Monday, December 30, 2019
Sunday, December 29, 2019

Saturday, December 28, 2019
How I spot Thomson Medical before it started to explode upward?

Traded the above stock on 18/12/19, entry price at $0.061. Decided to post a "Estimation" in investingnote.com.
Seven trading days later, price went up to $0.067 with enormous trading volume..
Expected the price to run up to 1st supply zone near $0.075.
Perform my scanner again on 28/12/19. Thomson Medical appeared to the no.1 base on criteria for break peak scan.

A look at the daily chart on 28/12/19

A look at the Weekly chart on 28/12/19

With the enormous upbar, it will likely to attract sellers who have bought much higher price earlier
and looking to even out without loss or breakeven. As such, daily pivot level 0f $0.065 will be observed next week to see if the price can hold above PP level.
Personal Opinion- there is still room for higher price, nevertheless, no matter what we think about the stock will do or not, the market will always prove us wrong therefore always be on guard for sudden change in emotion swing and exit quick enough to breakeven or make a small profits.
Happy Profitable Trading in 2020!
Cheers
Saturday, December 21, 2019
Why I decided to sell UMS on 17th December 2019?

Entry price was at a good level of $0.76. Waited patiently over the months to detect any sign of weaknesses that could cause the price to retrace back to its support level.
On 13/12/19 - the proprietary system triggered an expert alert "lack of demand", inorder to be sure
that the alert was correct, I had to analyze the chart carefully and decided to monitor the price action for the next few days till 17/12/19.
The price looked weak and decided to reap all the profits and wait at sideline unless there is clearer signal to re-enter this bandwidth to join the trend again..
As of todate, the price is weakening due to end of year and festive season, this is clearly shown on the reducing volume bars. Expect price to go lower until the next level of demand zone is strong enough to absorb all the sellings to stage an upturn.. till then, be happy with the harvest and move on scanning the next potential candidates... I have a few in mind and timing is important and buying usually occurs in a down bar...
All the best in 2020.. Happy Profitable Trading!
Monday, March 11, 2019
Why I traded Hi-P International on 12th February 2019? - till date it has traded 70cts up per share..

12th March - updated chart EOD
As shown on 11th March chart above, the trading system triggered "Professionals Distribution" yesterday and
indeed today we witnessed strong pull-back towards day's low of $1.73 before closing the day at $1.75.
There are still sellers out there, inorder for the price to move higher, sellers have to be absorbed.
For the next trading sessions, stay sideline and watch how the chart will evolve.

13th March - updated chart Morning intraday
Today triggered "Top Reversal", with average volume...Let's see if this is a flush out for weak holders....

26th March - updated chart EOD - Cut loss Alert starts to appear

28th March - updated chart EOD - Cut loss at day high $1.59

Tuesday, March 5, 2019
Eveyone knows how to buy shares, but knowing when to sell is a special skills?

Above is a weekly chart of Hi-P International. As the shares started to bottom again in January 2019, I continued to monitor the smart money activities. The proprietary indicators started to show "Markup Bullish" on 2nd week of January, telling me that the smart money is getting into this stock soon. By early February, the relative strength line began to move above zero line meaning that the stock is moving in sync with the STI index. Subsequently, in mid-February, "Uptrend indicators were triggered over 15th and 22th confirming that the this stock is going to fly.
I took a trade on the 1st "uptrend' trigger on 12th February at $1.02..
Watching patiently for the smart money to unload their inventories... Till date, 6th March, I am watching the stock is being tested for a higher price. The range of test is between $1.47 to $1.60 range. Breaking either side will determine the future of this price trend.
As such, for now is to wait patiently for the chart to evolve.. No need rush to add lots or sell early.
Let the market tells you what you should do next.....
Be patience, let the stock trends until its bend.....
Happy Profitable Trading 2019
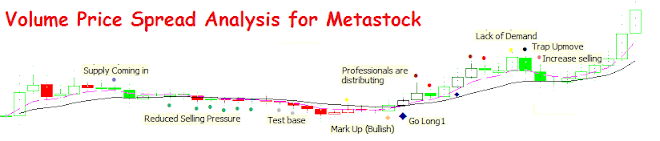
Saturday, February 17, 2018
Trading Strategy updated//

Taking above chart as a good example to illustrate how to ride a trend until its bend.
Above is a perfect chart for this strategy, although most of the time, we may not be able to pick such trending stock, nevertheless, we are not trying to spot home run stock which nobody can predict the future trend.
The logic behind this strategy is to divide the trading capital into 5 equal parts. Each entry will use 1/5 of the total trading capital. The reason is simple, if my initial entry is wrong, I can exit with small losses instead of putting the full capital sum into initial trade.. Frankly speaking, how many times will the share price pulls back after we execute the buy order in the market? I believe many of us have such a feeling of been lousy. But if you are confident with your analysis and understanding of the market mechanism, you know that the share price will head higher or lower after a few sessions.
Assuming after the initial purchase at no.1 location, and price starts to move higher to no.2 location and gain support from the blue dotted line, this is the time where we start to make the 2nd purchase and let the trend does what it best doing.
Subsequently at location 3 and 4, purchases are made with the support of the blue dotted line.
As price move higher and faces resistance from sellers, it starts to bend and break down the dotted blue line with Red price bar, this is the time to call it quit and exit from the market immediately the next day.
Throughout the trend trading from location no.1 to 4, the price bar never changes to RED, meaning the price trend is still in-tact, no need to think of selling and only think harder for the next accumulation location.
The above strategy is good for people who has a full-time job and do not need to trade often in the market. The effort required is the 1 hour everyday after work to look at the price chart and ask the following questions.
1) Has the price bar turned RED?
2) Has the price gone below the dotted blue support line?
3) Any of the weakness indicator triggered recently? e.g. lack of demand, trap upmove, professional distribution, top reverse, end of upmarket etcs..
Continue to hold as long as the price can trend..
Patience and perseverance.. Win the trading game in 2018
Subscribe to:
Posts (Atom)