Tuesday, December 28, 2010

281210 - I decided to trade Straitsasia when the momentum is RIGHT


Hi Traders

Referring to my earlier post on 24/12/10 where I explained the strategy that I would use to trade Straitsasia.
If you have missed the post, check it out below link:
http://volume-price-spread-for-metastock.blogspot.com/2010/12/241210-road-to-riches-depending-on-how.html

Straitsasia has been meandering within channel since May until today. The angle of the slope is above 45 degree which provides me with the clear indication that this stock has been a favorite by many
professionals. I had advised that I would be watching this stock for the next 1-2 weeks to make sure
that the base support is strong enough for the price to move up north again.

Today, the price displayed strength and I decided to take a speculative stake with calculated risk. None of my expert indicators has triggered positive buy signal yet. With past experiences, if price continues to move up for the next 2-3 days with average volume, I am sure that one of my indicators will trigger me to go long with this stock.

I hate this guts feeling to buy before my expert indicators say so, but sometimes it takes GUTS to stand up for what you believe and be responsible for the outcome. In this case, I chose to go with my GUTS feeling and please pray for me.

During the course of my trading years, I have developed numerous calculators such as Risk to Reward, Pivot Point and Fibonacci.

Below is one of the calculators that I use when planning a trade.

As an example, I use StraitsAsia for illustration.

Lot Size: 10lots (1 lot = 1000shares)
Buy Price: $2.51 (above pivot level and moving averages)
Cut Loss: $2.43  (below recent's support level)
Target: $2.75 (past known resistance level)

With the above information, I will be able to obtain an estimated rewards ratio for this trade.
If the ratio is less than 2, I would not consider to take trade.


Till then, cheers

Wishing you and me alot more profitable trades in the New Year 2011.


281210 - A week after I made 39 percents Returns, I am back today again.


Hi Traders

If you have been following my blog post, you would have noticed that I had sold off OSIM stock on 17th December after enjoying a hell of a good ride. In that post, I uploaded two charts on why I decided to sell and where were the possible support level after I sold off. If you missed the post, click on the link >>  http://volume-price-spread-for-metastock.blogspot.com/2010/12/171210-closing-trade-on-osim-after-good.html

In the post, on the weekly chart, I mentioned that I was watching two possible support levels, $1.30 - $1.45.
If price could maintain above either level, the up trend would be intact.

Look at the above chart, one day after I sold off on 17th Dec, OSIM traded to a day low's of $1.45 on 20th Dec. I was sitting on my trading desk watching how this level would be supported. If this level could not support the fall, the next possible support would be $1.30 level.

20th Dec day's low of $1.45 turned out to be a nice support level, price started to move sideway and along
the channel low. Expert indicators such as "Reduced Selling Pressure" were triggered in two occassions
indicating that the sellers could be taking break and nolonger eager to push price lower.

Indeed on the 27th, price started to turn positive with narrow spread. This was a good sign to show that price was nolonger going down.

23rd & 24th expert indicators "Reduced Selling Pressure" had clearly indentified that the price had bottom and 27th was the confirmation day.

With background strength for the past few days, OSIM was bought in by Smart Money therefore the price closed at day's high of $1.61 with substantial volume to support this buying spree. I decided to follow this
buying momentum and joined in the game while I know that most of the traders could be feared and recovering the shock when OSIM fell from $1.71 to $1.45 where profits could be totally wiped clean.

Amazing, my proprietary indicator triggered " Smart Long" after end of the day which is a Buy Signal.
Look at the Diamond Scanner below, OSIM was picked up from the 900+ stocks to be further analyze by
me for the tomorrow trading business. When both "Smart Long" & "Go Long" are shown on a particular
stock, it usually commands my attention to do further analysis on the underlying support and demand.

Just like the rest of the stocks with both expert indicators triggered, "Genting HK", "Cosco", "Indofood" etcs
these stocks are likely to display strength after the Diamond's appeared.

Therefore, you may want to check out these few stocks besides OSIM, you maybe hitting the jackpot again.


Till Then, Happy Profitable Trading and Happy New Year 2011.


Friday, December 24, 2010

241210 - The Road to Riches depending on how you draw the Trend Channel.


Hi Traders

A well drawn channel lines that are touched numerous times as price meandering between the top and bottom channel lines provide very  solid trading experience and rewarding treats if handle with surgeon's
precision.

As price moved forward with time, the expert indicators will automatically reveal the activitiy of the professionals. By exposing what the smart money is doing next, does provide abundant of trading
insights and opportunities to an average trader.

Armed with these expert trading indicators and scanners,  I would feel like sitting besides a
professional trader, watching him performing his daily trading plan and follow him closely
with every precise trade execution with calculated risk to minimise error.

Knowing what to expect next does provide better opportunity and probable outcome. But nothing is
far from the truth that trading is just a probability game. How to increase once's opportunity to win consistently with mimium losses is the dream of every trader.

I am lucky to be blessed with a logical mind that can put trading ideas into programming codes and successfully created a series of time tested scanners which assist  to pick, pull-back stock,
advancing stock, shorting stock and more. My stock analysis has really took a quantum leap after
completed the first version of  this propietary scanners and indicators early this year.

Back to the chart now, as we can see that the price has been meandering around the lower channel
line for past one week with "Reduced Selling Pressure" expert indicators.

This is to tell me that the selling has subsided for past one week and sellers are not pushing hard on
the price. Even though the price is well supported above the channel low, does not command a
Buy Order. We need more confirmation to make sure that the price is ready to move higher in
this so-called "Buy Zone"

I would like to see that the price bar turns "Green" and the trend cluster which is below the volume
bar turns "Green". With both trend indicators showing identical direction, will I consider that the
price trend has changed from down to up.

For now, it is best to stay patience and watch how the price bar will evolve for the next 1 - 2 weeks
before deciding a trade to the Long side.

Don't rush to lose money, the market is always ready for losers. Stay alert and patience, when
opportunities come, strike like a wolf  onto the sleeping herd of sheep.

  • Eight years of trading experiences, I learned that being patience is a virtue many times.
  • Trying to catch a run-away stock is like digging my own grave. Never be greedy to chase an
    explosive stock.
  • Look to buy a stock which is on a healthy uptrend and has now returned to its support level to consolidate strength for the possible explosive upmove in weeks or months ahead.

Merry Christmas and have many Profitable Trading Ahead!

241210 - Wilmar Has Fallen 19 Pecent, Is This The Right Time Now?


Hi Traders

After my analysis on 171210, explaining how the chart should be traded and why I didnt take a trade
at the end as Wilmar was not ready to move up. More confirmation would be needed to command
a trade.

Today, five days after my analysis, Wilmar plunged further down and I was lucky that I did the right
analysis not to take trade on 171210 where the single positive indicator "Demand Coming In" was
triggered but not substantial enough to make a trade.

So is Wilmar ready to move up from here. Well, the reply is the same again, we need more
confirmation again. Today's Wilmar triggered "Reduced Selling Pressure" on a  half-day trading
session due to Pre-Season Half - Day Trading.

So what will consitute to a potential rebounce from the level. Well, I would like to see that the
following things to happen next..

1) Price continue to move slowly up with less volume and maintain above recent low of $5.60
with possibility of base testing again, this may tell me that there are no sellers to push price below
the recent's low.

2) A climatic action that open lower than the recent's low but with wider price spread up and huge
volume, this will tell me that the professionals are eager to buy into the low price position.

3) Price bar becomes GREEN and the Trend cluster below the Volume bar turns GREEN too. This is a clear sign that a new trend has taken place.

Without the above, no trade will be done for sure.

 Just be patience like a Wolf behind the bushes and waiting patiently for the Herd of Sheeps to move nearer to your advantage and strike with precision.

Saturday, December 18, 2010

171210 - Is Wilmar ready to stage a rebounce?


Hi Traders

Price fell from point 1 due to increased selling activity from the professionals, at point 2,
we witnessed that the selling had decreased and price started to move higher, this activity
of supporting the price from falling deeper was clearly identified by my propietary indicators,
"Markup (Bullish)" and followed by another "Test Base" to confirm that the selling had been
absorbed by the professionals, when there was no supply in the market, price would slowly
find its way up and any demand can easily moved price higher.  With "Go Long1, Blue
Diamond" indicator appearing after a few sessions later (mid october), it was clear that the
trend was indeed heading for higher ground.

So how would I know when to take profits?

Let's discuss further, after the "Go Long1" was triggered, price began to fall due to profits
taking as price had touched the long term support line( Orange Line). This pullback was well
supported well by the 13 days Moving Average (Black) and price rebounced and broke
the orange support line (A) , which was  the resistance line.

Price continued to head higher toward point 3 but with weakness. This was indicated
by the "End of Up Market" and "Lack of Demand" denoting that the trend may had peaked.
This was the time where one should decide to take profits and stay sideline.
Further weaknesses was confirmed by the "Supply Coming In" the next day that brought
the price back to the support level (B). Continuous weakness caused the price to break the
support level $6.18 in mid November.

With the last defense (C) support line set at $5.90, I was eager to see if this final support would
fail to hold the price again as I am planning for a Long Trade for possible sign of trend reversal. 
My stock scanner picked in "Demand Coming In" indicator for the end of day session, 17th Dec.
Since this is the first sign of positive indicator, I decided to probe more into the price & volume
action. Just by drawing channel lines and moving averages, I would be able to estimate the
probable support or resistance level in the near term.

As can see from point 4, "Demand Coming In" indicator is triggered with nice price range and
average volume. A few sessions back, "Reduced Selling Pressure & Test Base' indicators
appeared numerous times as the price moved towards point 4.
On close observation, we can see that the 17th December Day's Low (point 4) coincided with
similar low point held strongly in last September (point 2), so is the stock ready to stage an
upmove from now.

Is this the correct timing to go long now?

Frankly speaking, it is still too early to tell. One single day of positive activity may not mean that
the price is going to move up from here. So what clues am I looking for next?

As you can see that the price bar is colored Red and the trend ribbon below the volume bar is
also colored Red. If the trend is ready to move higher, I would want both the price bar and trend
ribbon to turn Green, giving me a firm confirmation that the trend has indeed turns positive.
 If a surprise "Go Long1,Blue Diamond" does appear from now onwards, I can firmly convince
that the trend has turned up and provide good rewards to risks returns.

As you can see, I do not use any standard charting package tools such as MACD,RSI,Stochastics Oscillators, RMI, ADX and more...Reason: Everyone is using the same standard indicators with standard
settings. An astute trader or your trainer can easily tweet the indicator to give much earlier entry or exit
therefore where is your competitive advantage in this ruthless game of money.

Learn how to read the price and volume activity (bar by bar analysis) as both are the real-time indicators of all. Others are just derivatives and may give contridicting triggers at times when combine together.

If it is so easy to use standard indicators to trade for a living, we would see many successful traders among us, many would have Fired their Bosses and stay at home.

 Trading financial instruments are not so simple as you think.Spend more time to educate yourself instead
 and don't rush to trade as the Markets will be there even after we're gone.

Until then, cheers..

Happy Profitable Trading Ahead!

Tuesday, December 7, 2010

Another Powerful Demonstration of Diamond Trading System.


Hi There

This is another chart showing the powerful Diamond Scanner that picked up Sunvic on both "Blue Diamond" occasions. The strategy to buy is to wait for the next day after the Blue Diamond appears, this is to make sure that the stock continues to trade higher before a Long trade can be transacted because the Pivot level on the  Blue Diamond's Day is used as risk control or cut loss level.

Sure enough, when Blue Diamond appears, price will always move quickly higher and without triggering the
tight cut loss level. For e.g. on 07/09/10 cut loss level was set as $0.33, and  4/10/12 trade, cut loss was set at $0.39.

Both of the two cut loss level were not triggered and price soared higher from there.

This is how I Scan for Potential Setup, Analyze if the Diamonds are Genunine Before I invest in these Pretty Stones.

Current trade such as Osim is over 50% Profits level and previous trade of Golden Agriculture of 35% possible Returns. Recently just transacted Biosensor on 23/11/10, and price moved away from the cutloss
since day 2 and until today it is still "IN THE MONEY". Would it be good if the stock moves towards
break even level after purchased each time.. You  Bet.

None of my trading method involves complicated formulas or popular technical indicators used.E.g. MACD,ADX, Stochastics Oscillators, RSI, RMI.

Just by simply understanding the nature law of Demand and Supply, Lack of Demand and Supply with
drawing of Channel lines, support and resistance levels and Simple Moving Averages. I can easily determined
the FORCES behind the Professionals activities and enjoy a good hell of a ride with them.

Till then,  Happy Profitable Trading Ahead!

Sunday, December 5, 2010

A whopping 46% Profits Level and Price will continue to go higher

Refer to the blog post on 3rd November, I wrote two posts....


On the first post, where I demonstrated on how OSIM price would continue to go higher with clear
strategy.
http://volume-price-spread-for-metastock.blogspot.com/2010/11/how-to-know-if-stock-will-continue-to.html

and on the 2nd post, I showed how where I took the trade on OSIM and gave clear indicator when I should
harvest the profits.
 http://volume-price-spread-for-metastock.blogspot.com/2010/11/how-to-know-when-to-sell-when-stock-is.html


Till date, there is no sell signal yet. The stock has met my 1st target level of $1.60, a whopping 46% profits  from my bought price of $1.12 in October, just merely 33 trading days of holding.

So if there is no sell signal now, where will the price be heading next? my price projection shows
a target near $2.10 in 1st quarter 2011. Hopefully, i am right on target again.

As you can see, I have covered how I traded Osim from the start and analyzed the trade along the
way in this blog, it is not a coincidence or lucky trade.

This trade is carefully planned and traded as it appears in my Diamond Scanning System.

This is one of the many  trades that appear to me each time for analysis when pick up by the
Scanning System which is capable of detecting the unusual activities of any stocks and display
them for my further analysis for possible transaction the next day.

Till Then, Happy Profitable Trading.

Saturday, December 4, 2010

The Power of Knowing When The Trend Has Ended or Just Started to Move North

Add caption

Hi There,

This chart demonstrate the Expert Indicators that appear automatically as price moves forward each day.

You may ask how do I know if the Stock Trend is going to Peak off and started to turn south.
Look at the chart above, as stock peaked each time, there are cluster of indicators showing that
the Stock is getting weak as its approaching would-be Peak level. E.g. Early January 2004, the
indicators showed that "Professionals are distributing" and followed by "Weakness coming in &
"Supply coming in".  When cluster of indicators presented subsequently, denoted very powerful
trend change.

In 2006 and Mid 2007 demonstrated again the Capability of the trading system to show that the
Stock had once again peak the trend and weakness subsequently brought the stock trend down
the hill.

On the Bullish side, when a new uptrend is forming, the system is capable of identifying the exact
spot for Long trade. E.g Early 2003, before bullish indicator "Go Long1" were triggered, weeks before
, "Reduced Selling Pressure & Test Base" indicators appeared numerous times to confirm that
the base foundation was strong and tough to stage an upmove later. The stock moved from 2003
year lowest value of $0.17 and peak on March 2004 at  $0.74. Enormously returns indeed.

This was not a concidence case, in March 2009, the stock based off with cluster of indicators
"Reduced Selling Pressure + Go Long1" appeared to indicate that the stock was once again ready for another upmove. The March 2009 Lowest value of $0.19 had moved north until today 3rd December
2010 of value $0.32.

If you ask me if the stock trend has reach its peak today, the answer is clearly "No", because the
cluster of bearish indicators have not appeared yet. Until then, just hold on to the stock and let the
stock to trend until its bend and turn south, by then, you will be presented with those cluster of bearish
indicators and its the time for Harvesting. 

The job of a Successful Trader is to Trade Well Each Day, not Counting Daily Profits.

If you trade well each time, you will be rewarded naturally.

Till then, Happy Profitable Trading Ahead!


Monday, November 22, 2010

Power Strategy #3 - Go Long + Uptrend Arrow


Hi there,

I did a stock scan for end of day and the above stocks are picked up by the Blue Diamond Scanning System.

I am particularly interested in the first stock that is listed," Biosenor" which has good amount of transaction today.

Below is the chart which shows clusters of bullish signals, "Test Base + Go Long + Uptrend".
This is a powerpack combination and I am sure that this stock has more to show us in the near
term even the overall current market condition is weak and indecisive.


For the this trade, cut loss is set at $1.12 and below, the target is near $1.30 - $1.35, duration: 1month ++

Thursday, November 11, 2010

The Power of Diamond Trading for Maximum Returns

This stock is picked up by Diamond's Scanner for potential Long or Short Order this week.

The diagram above demonstrated how the Diamonds (Long or Short) were triggered in the past
and providing enormous profit advantage and reduced risk (cut loss was placed just below recent
support or resistance level).

Thanks for reading! More Profitable Trades ahead.


Wednesday, November 3, 2010

How to know when to sell when the stock is IN-THE-MONEY now?

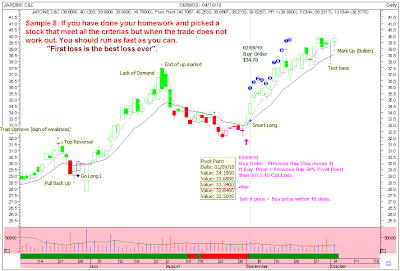
 With reference to Sample 8, a much earlier blog post as below:
http://volume-price-spread-for-metastock.blogspot.com/2010/10/sample-8-simple-strategy-to-cut-loss.html

I am going to demonstrate on how I manage to hold on to a stock until the trend is against me and I am force to take money out from the stock.


After transacting this stock on 21st Oct which counted as Day 1, I waited for the next 10days to see if the
cut loss will be triggered and I will be out of this game.

Fortunately, the stock trended higher after Day 1 until today which is the Day 10. Within 2 weeks, price managed to trade higher without trigger the cut loss system, so how am I going to manage this trade from here onwards. The strategy is clearly defined in the Sample 8 in this blog or click on the above hyperlink which will bring you to the post that I have created much earlier to demonstrate how I protect profits from a stock.

Back to this stock again, on Day 11, I will be switching to weekly chart instead of daily chart to monitor
the stock price. The reason is simple as I want to give the stock some room to move.The weekly chart is
good at reducing unwanted short term noises and provide smoother trend. Daily chart is easily manipulated and a good negative day can easily send you out of the game and stock continues to climb higher within the same week. Therefore inorder to prevent such incident to happen, I switch over to weekly chart to monitor the trend and channel strength while using the daily chart to detect short term weakness and price fluctuation.

So when will I take profit or exit this trade? From now, I have to wait for the Sell signal to appear in the future. When that happen, I will follow-up with another chart that explains why I decide to quit and take
profit instead. Till then, continue to follow me through this trade..It may take days, weeks or months ahead,
when the time has come to take profit, you will be informed without gimmick.

This is also to demostrate how anyone can trade a stock effectively which still working for earned income.

Best of all, you can enjoy trading stock at your comfort level and make subtantial income to pay for your luxurious toys or food.

Trading is not without RISK, you must accept RISK inorder to trade. I respect RISK and I manage IT.

Thanks for Reading!

How to know if a stock will continue to TREND HIGHER?


Look at the huge transaction day and wide price range as shown by the enormous volume bar
denoted by the black arrow.
Usually, the stock will  be subjected to profit taking. As such, I need to know if the selling pressure
is strong enough to digest all the profits made in a day.

Using the high transacted day price as reference, obtain the Pivot Level for that day. As shown in
the chart, the Pivot Level is $1.20, therefore this value becomes the new profit protect level from
now.

As long as price continues to trade above $1.20 and above, I will continue to hold on to the stock until this level is breached or a new profit protect level is set after the price moves much higher.

In this way, I can secure some profits if the price starts to tumble below the Pivot Level.

The reason why many fails to survive in trading is due to lack of Money Management System which needs not to be complicated. You need to know when to sell or buy, when to cut loss or take profit.

Never be greedy to make another cent. When I sell, I choose to sell to the Ready Buyers and when
I buy, I choose to buy from the Ready Sellers and close my notebook to do my job as an employed
IT Engineer.

You need not stick to watch the stock price ticking real time, that will definitely kill you as a newbie.
I did that for nine solid months full time in 2003, great profits but intense stress and I hate to stress
myself while making money.

Trading should be fun and easy to do like watching a movie and indeed after years of improvising new
trading strategy, I develop this current trading system that can provide me with portfolio income while
working on earned income.


Thank you for reading again!

Power Strategy #2 - Test Base+ Go Long combination


After a weak market was triggered in January 21st 2010, the stock price tumbled $0.40 and found base
in early February as detected by expert signals (Price Pull Back Up and Demand Coming in).

For risk averse traders, this could be opportunity for trade but for my trading style, I would like to wait a little
longer to observe if the trend was indeed trending higher. I would wait for the price bar to change from Red Colored Bar to Green Colored Bar and the Trend Cluster at the bottom of the chart (just below Volume Bar) turned from Red to Green.

Luckily for me, I have a proprietary scanner that would pick up stock that meets such a strict criteria (Test Base + Go Long1) from the chart above.

This combination means that after some weaknesses in the background for sometimes, the stock is nolonger falling south (Stage 4)  but starts to move sideway (Stage 1) to consolidate strength.
Once the strength is built up to move northward, a "Test Base" is usually good to know that the selling activities have been absorbed and price is ready to move up with no selling pressure.
With "Go Long1" picks up after "Test Base", I know that the Professionals are ready move this stock price higher definitely. Look at the chart above and see for yourself.

Again and again, this combination is always ready to pick up any stock that is ready to stage an upmove.
Although there is no certainty in trading, there is always the probability of a good setup with strict money
management scheme to capture this profit opportunity.

Thanks for reading and many Profitable Trades ahead!


Monday, October 18, 2010

Power Strategy #1 - Stopping a down move + Go long combination

     (A stock from KLSE, Malaysia)  

       (A stock from Singapore)

Woo, this is one of the many combinations that my Powerful Stock Scanner can pick up.

At first, price started to pull back towards moving average line and broke down. Falling price
was halted by "buying-in" from the Professionals and this was automatically alerted with a symbol
below the price bar.

Immediately after the price was supported (Climatic Action), Professionals continued to move price
higher. Price closed near the day high denoting enthusiasm to move higher the next day.

The Professionals aggressively accummulating the stock was denoted with a Blue Diamond symbol.
This was clearly illustrated again in the Mid-April and Early-June.

In many cases where Blue Diamond appears, price will immediately move higher away from the cutloss trigger set from previous day pivot level. So if the cutloss level is not triggered, continue to hold the stock and
adjust the cutloss level as price moves higher to protect the profits.

Do not be greedy, be happy to exit the trade if the profit protect level is triggered.

Use the scanner to pick the next potential stock for such a combination again in any stock exchanges.

Next posting, I will show Power Strategy #2 - Testing Base + Go Long Combination.

This is where the Professionals will probe the stock price to see if there is anymore sellers before
launching a delibrate pushing up of the price quickly.

Catch up with you again, bye.

Thursday, October 14, 2010

14th Oct - Sold off the remaining 50% of Golden Agri Shares. Found Weakness!


As expected, today's traded volume is much lower than yesterday massive volume as such
I watched the price bar closely.

As compared to yesterday's price range (high - low), today's price range is much narrow due to
the fact that there are still potential sellers where the demand is met by strong supply therefore
the price is locked within a tight trading range.

The weakness is confirmed when price closed at day low with high volume. If the Professionals
are interested in higher price, we should be expecting further upside today but this is not the case.

For now, I am expecting price to find support level near to yesterday's pivot level @$0.64 before
testing the near term price target of $0.72 level in weeks ahead.

Just be happy with what I harvested, move on to the next profitable catch using Diamond Scanner again.

Good Luck and Many Profitable Trades ahead!


Wednesday, October 13, 2010

Sample 10: Will price continue to trade higher from now?

Hi, if you have followed my sample charts from the beginning, you should not miss Sample 5 chart analysis on Golden Agriculture Resources on 29th September 2010 where I spotted three weeks of reduced selling pressure and commented that there is a possibility the price may rebounce soon.


Indeed two weeks later, 13th October 2010. Massive price movement today and this is no coincidence at all. By Mastering the art of intrepreting Demand and Supply in the Market, I am able to predict what the
SMART MONEY activities thereby taking advantage of the situation.

Interesting, I would usually exit all or partial during a massive bull run day. I did it again today by selling
50% of my  holding to secure a nice pot of profits on the table and leaving the rest of 50% soldiers to fight through the upper channel wall (known resistance level).

After the Market closed at 17:05, I re-evaluate the stock to make some assumptions for tomorrow's session.

How I know that the bull run will continue tomorrow or fade out completely by tomorrow?

The answer lies in the today's transacted price and volume.

From the chart, price has just closed near the upper channel line which is $0.655. Breaking out of
this channel by tomorrow will be bullish as the upper channel line can become the new support level
for the price to propel further northward.

What if price really pull back tomorrow, what will I do next?

In my Personal Trading System, I utilize the Pivot Point for cut loss or profit protect strategy..
Base on today's closing, the pivot point is $0.63667. Therefore my profit protect level will be
set as $0.635 for tomorrow session. If the stock is subjected to massive distribution by tomorrow,
I will be out of the game at $0.635, generating 6.5cents of profits on 50% holding.

Another scenerio could be today's volume is not sustainable, therefore I expect the tomorrow volume
to be significantly lower and inorder to know if price will continue to go northward, I hope to see a small
negative price bar closes within the body of today's bar. See sample below.

This sample shows that after a massive upside the previous day, everyone will be wondering if the price
will continue to head higher or subject to profit taking.

When price pulls back with much reduced volume, this will show that "Yes" there maybe some selling pressure but the pressure has reduced significantly because the closed price is not lower than the low of the massive upday. This is a bullish sign and may mean that the Professionals may want to move the stock price higher very soon and they are just taking a short break.
So this is my way again, let's see what happens tomorrow then?

Anyway, the stock price is now in the upper channel level denoted as Sell Zone (Above the dotted red line).
It's time for harvesting.

                         Being GREEDY in the market is the Sure way to lose BIG.

Tuesday, October 12, 2010

Sample 9: Excessive Volume Upbar may not be a good thing


Looking at the two marked areas with extremely high volume with positive closed. But
what happened the next day? Price began to tumble instead of moving higher. This
is really confusing as why price fell after a solid upday on the previous day.

This is clearly detected by my Expert Indicator which showed the message "Professionals are
distributing". But why distributing and not accummulating more to the upside instead.
The reason that I can imagine is that the Professionals with huge book orders are unable to
unload all the shares at in a quiet market place. They have bought much earlier at a discounted
price and waited for the right time to unload the inventory to make a pile.

The only way to unload the massive inventory will be during a bullish market day where there are
more demands. This will be the time where the Professionals will be able to unload to the demand side of
the market. After unloading, there are no reason for the stock to go higher  and this can be verified
by the next trading day volume which is usually average to low volume. Price will start to move lower
to find its next support level where the Professionals will enter again to accummulate the base which
later become the FULCRUM for the price to move higher again.

This is how I interpret the market, this is my way!

Thanks for reading!

Sunday, October 10, 2010

08th October 2010 - Exclusive Analysis on Taiwan Stocks

Just happen that a taiwanese friend has asked for my opinion of some of his stock picks.
I decided to use my Diamond Scanner to pick a few stock for him beside analyzing his
self-picked stocks.

My Scanner report as below:


These are the stocks that meet the criteria for Long Order. I would usually check each of the stock chart for better understanding if there is trading opportunity.

For example, I check on the 1st stock which is Kinpo Electronics chart and plotted line studies on it.


My Study suggests that there is a good probability to take this trade as price is trending along the lower
channel and within the "Buy Zone". It may take a few more days for the price to build strength to trade
above the dotted blue lines which is the safety zone for price to head higher towards the "Sell Zone" for harvesting. Till then,

Good Luck and Happy Profitable Trading Ahead!

Tuesday, October 5, 2010

Using RTD Function in MSExcel for my Portfolio Management


Using simple spreadsheet to manage my Profit & Loss for each transaction.

Most of the fields are automated except for buy price, sell price, lot size and cut loss price.

Monday, October 4, 2010

Sample 8: Simple Strategy to Cut Loss and Let Profit Runs. I did this my WAY!


There are many risk management books that tell you how to cut loss and take profit when necessary.
The most important of all, the strategy must suit your own Personal Trading System.

Most of the trading books are catered for very short term trading such as Futures and Forex as
such applying the same methodology to slower Stock Market maybe backfired as the cutloss is
either too close or too far away.

The key  issue here is when the cutloss level is triggered, will you be brave to cut away the losses
and endure temporary pain instead of ending up with losing position that deteriorate over the time and
most intense pain. I always believe "First lost, the best lost".

The strategy that outline here is solely for my style and may not be suitable for you, if you like too, you
may try this strategy too.

So what is my intention on this risk Management?

After analyzing multiple timeframes, monthly, weekly & daily chart of a stock which is picked up by my
proprietary diamond scanner. I will have an good idea where will be the next resistance level.
Therefore if this trade is taken, I am expecting the price to trade higher from the buy price and if that
does not happen, I have this strategy to follow:

Sell if closed price < 50% Previous Trading Day Pivot Point(Transacted Day - 1)  or
If Price < Buy Price within the next 10 days.

Ok, why "Sell if closed Price < 50% Previous Trading Day Pivot Point"
The reason is simple, this method is used only during Initial Buy Order so that
price will not close below Previous Day Pivot Point. If it does, then expect price to fall further
until a base is formed or supported. If price does not trigger this cutloss, price should be
moving away from the cutloss level. This provide the 1st assurance that I can break even soon.

Next, If  "Price < Buy Price within the next 10 days = Cut Loss"
If price does not trigger the previous day Pivot Point, price should be heading north. Giving
a short time frame of 2 weeks to see there is internal weakness and price cannot sustain the
upside and start to fall and trigger the cut loss.

If both of the risk management are not triggered after the 10th day, I will utilize the weekly chart
as the base for holding on the winning stock while using the daily chart to spot potential weakness
in the trend.

Most of the time, while the weekly chart is looking positive and price is pulling back to support
level in daily chart. There is no cause of alarm.

The time to stay alert and take profit will be when the weekly chart and daily chart are showing
trend weaknesses or expert indicators that appear in the upper channel level such as "Trap Upmove", " Higher Price is stopped", "Top Reversal", "End of Up Market", "Lack of Demand", "Bearish" or
"Increased Selling Activity".

What goes up like a rocket, will do the same as it comes down. So do not buy "HOPE" in the trading
arena, it will be too painful and expensive to bear.

When the both the Cut Loss Strategy have not been triggered, I will revert to weekly chart as shown
below to allow more room for price to move further up. While using daily chart to detect early
sign of weakness.


As I said before, this is My Way. You may have a better way to do it.

Important, we just want to take some profit from the Market each time, no matter what
kind of methods we adore.

Best Wishes and Making Profitable Trading Ahead.


Thursday, September 30, 2010

Sample 7: Buying does not need to be GUESS WORK


Buying can be a sure thing when cluster of positive indicators appear within the week or so.
This gives you the strong conclusion that "Yes", Professionals are in the game to provide
good support to the base so that price can propel further from here.

There are many powerful indicators in this Personal Trading System. I have spent more than
six months developing, testing and fine-tuning each indicator as precisely as it can be to pick up
the Smart Money activities such as when they are accummulating, distributing and idling.
Comparative Relative Strength to the Index and Moving Averages are used in my System
as references. The most important skills that I have developed over the times is to
interpret the Daily Demand and Supply with just Price and Volume only without additional
indicators such as MACD, RSI, ADX, STOCHASTICS, Moving Averages.

Yes, just Price and Volume using Candlestick. During my free time, I created many training
tools to improve my chart reading skills using Powerpoint, by reading each bar at a time and
decide to take trade or call it off, have made me more confident to even trade off with a mobile phone
that provide candlestick chart and volume.

This is what I have created to train my chart reading skills as below:
More than 50 charts with different cycles in stock trend are used for practising skills


What I want to achieve is to follow the Smart Money activities that drive the Market in either direction
to take some profit out from the trade each time.

The Expert indicators, Diamond's Scanner and  System Tester codes are not for commercial purpose.
It is solely for my Personal Trading and shared with a few good buddies.

Expert Indicators will appear on the price bar each day if certain condition is met. The programming
codes involved Price Action (Open, High, Low, Close) and Daily Transacted Volume.

The Purpose of the Expert Indicators are to decrypt the nature law of Supply and Demand in the Market Place each day, not forgetting the Professionals activities are registered in the Volume bar.

The key element in this Trading System is to predict the Professionals Activities in the near term with acceptable accuracy. Therefore a swift trade can be executed and profit can be made as the price starts
to rebounce from the successful "Test Base / Support Level". At this level, the Risk to Reward Ration
is good.

The Diamond's Scanner on the other hand, help to scan the whole SGX Market about 900+ stocks
for possible stock that meets the criterias for further analysis and possible transaction the next day as shown below. This Scanner also applicable to all tradable securities.


Using the same trading system for USA Market using http://www.updown.com/ with 1 million
dollar Practical Account.

With the Scanner to pick out trades, this is my USA Stock Portfolio.


Wednesday, September 22, 2010

Sample 4: Don't be greedy. Know when to take profit is utmost important as buying.


Everyone knows how to buy shares as long as you have money in your bank. Sadly not many know when to take profit and eventually causing a winning trade turning into a lose trade. How do you feel? definitely as lousy as you can be, self sabotage is common in this challenging Market Place.

Most of us are ruled by the two worse enemies of mankind, "Greed" and "Fear".

We want more and more and hope that price will go higher and higher and hopefully there is no roof to where price can go and we can become overnight trading champion. HaHa, I am waiting since 2001 and
have not witnessed such a miracle then. When Greed overcrowds our mind, we become irrational to make
decisive action to even take a portion of the profits out from the Market and leave the remaining one-third to
test your guts feeling.

When a stock is too far away from your entry level, you just can't give it up and look for another opportunity.
You just have to own this stock no matter what you feel. This is a part of your self sabotaging ego at work.

Witnessing price been moving up steadily for the past five days, you decided that you are not going to miss out anymore, the pain to wait for a retracement is too long to bear, impatience sets in and you decided to take a position in it. Once you have joined the herd, you feel great and glad that now you are part of the game. For the next 1-2 days, price may continue to move higher with reducing volume each day.
Knowing this could be the tell-tale sign of potential weakness in the price, you continue to hold as you are blind by the FEAR of not getting into the trade and also the FEAR of losing opportunity to get in.

Just one bad news that hit the wire, Market starts a new phase of profit taking. Unaware that the Professionals are actually pulling funds out from the Market, you decide to hold on to the position as you believe that the Market should come back up soon and luck shouldn't be that bad. And two weeks have past, the stocks that you have bought are now down by 30%, you start to worry and wonder what has happened and still hoping that the Market will come back up in the near future. Keep on waiting and waiting.....and you will discover that the transacted volume each day is getting thinner over the months and then years.

The Professionals are nolonger interested to move this stock. You keep on waiting and and resulting in holding the lousy stocks for months and even years sometimes. Finally,  you give up the hope that Stock Market is not for you anymore. Worse still, when you decide to cut loss painfully, within the next few days, the Market starts to recover and back to the breakeven level for your portfolio. Oh....You start to hate yourself for being stupid this time and more frustrated then ever.

When you buy, the Market declines, when you sell, the Market recovers.

This is really bad feeling and omen. You blame on luck and your financial advisor who gave you the stock tip earlier. Ha Ha.. Vicious cycle one after another.

Sometime you may never recover your losses and the stock that you may have purchased is suspended from trading. This is enough for you to spread bad feelings about the Stock Market experiences to your friends or loved ones that never to touch the Stock Market.

This is not a made-up story, It is real scenerios around us and we know people who had been caught by the Stock Market plunge, fear has overcome them, deep intense pain has taken control over their body and mind.

Do not talk "Stock Market" to this group as you will get a Karate Chop from them. HAHA..

Financial Skills is a learnt skills, it can be taught and learned well if given time and effort to understand
the underlying cause and effect of the Stock Market Price Movement. Beside learning how to Buy a stock,
you should pick up the other important skills on how to Short Sell a stock if the Market turns bearish.

Like me, I am a Computer Engineer who is interested in software debugging, reverse engineering to discover how an application is written and coded. I am curious and like to get into the root cause of each task that I handle. Likewise for Trading, by understanding the natural effect of the Market Demand and Supply,

I am able to create a series of programming codes that pick up stocks that are going to move up from the bottom of the channel or falling off the roof of the channel. With tedious repeated testing on Scanner codes to make sure that only a few out of hundred stocks are picked up for analysis and possible trade the next day.

Nothing is difficult if you have the heart and soul to learn and excel. Life is short, live with passion!