Disclaimers: - No communication should be considered as financial or trading advice. - All information in this lecture/course/seminar are intended and solely for educational purpose only. - They do not constitute investment advice in any manner whatsoever or have any regard to the specific investment objectives, financial situation or individual needs of any particular persons receiving them. - Examples are used for illustrative purposes only and do not constitute investment advice.
Sunday, September 6, 2020
Tuesday, January 14, 2020
Thursday, January 2, 2020
Wednesday, January 1, 2020
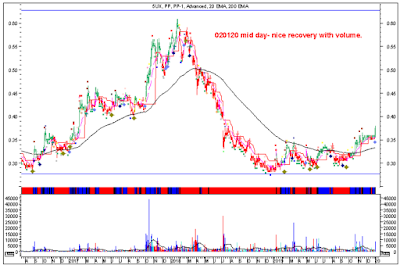
Oxley Holdings Daily Chart Analysis dated 020120 mid day
Looking at the chart, the stock is going into stage 2 advancing therefore inorder to
trigger a buy, need volume confirmation as well as "whatif" level to cut loss..
This stock is slow moving, therefore need patience to hold for a while....
Labels:
Oxley,
Trading for a living
Monday, December 30, 2019
Sunday, December 29, 2019
Saturday, December 28, 2019
How I spot Thomson Medical before it started to explode upward?
Traded the above stock on 18/12/19, entry price at $0.061. Decided to post a "Estimation" in investingnote.com.
Seven trading days later, price went up to $0.067 with enormous trading volume..
Expected the price to run up to 1st supply zone near $0.075.
Perform my scanner again on 28/12/19. Thomson Medical appeared to the no.1 base on criteria for break peak scan.
A look at the daily chart on 28/12/19
A look at the Weekly chart on 28/12/19
With the enormous upbar, it will likely to attract sellers who have bought much higher price earlier
and looking to even out without loss or breakeven. As such, daily pivot level 0f $0.065 will be observed next week to see if the price can hold above PP level.
Personal Opinion- there is still room for higher price, nevertheless, no matter what we think about the stock will do or not, the market will always prove us wrong therefore always be on guard for sudden change in emotion swing and exit quick enough to breakeven or make a small profits.
Happy Profitable Trading in 2020!
Cheers
Labels:
Thomson Medical,
Trading for a living
Subscribe to:
Posts (Atom)


